This blog was also posted on the Natural Resource Governance Institute website and the Open Oil website. It was written by David Mihalyi and Anton Rühling.
Many oil-rich countries’ governments reap huge and notoriously opaqueproduction revenues. In the past, transparency initiatives were limited to exposing tax payments. However, EITI reports and company disclosures are exposing more details on these deals. We are seeing a growing database of incisive price data emerging.
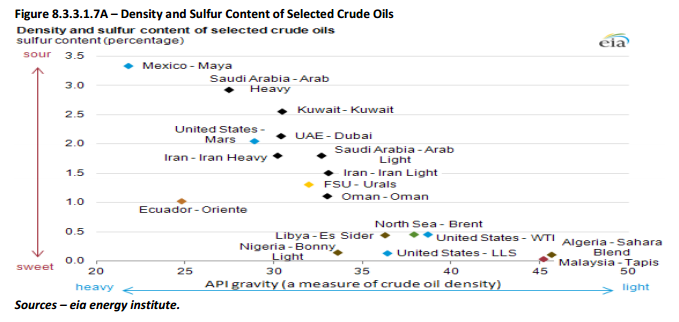
Many observers want to know how much the oil is worth and whether a fair price is paid for it. A common assumption is that the value of a barrel of oil is easy to determine. In fact, it’s quite complicated. The oil price’s daily fluctuations are closely monitored. These are done using the so-called “reference prices”: the value of a barrel of a particular oil quality sold in a particular hub. Every barrel, though, is worth a different amount. How light the oil is, how expensive it is to transport it to main hubs and how it is sold (on a spot or long-term contract) all factor in to its value.

Source: Screenshot from Page 349 of NEITI report, Original source is EIA.
A person wanting to know the value of their country’s oil once had three options: using one of the global free benchmarks, which lack granularity, as a best approximation; paying large subscription fees to access granular market data; and looking for revealing industry reports.
The recent release of EU mandatory payment disclosure reports have provided a granular and standardized new data source on oil prices. Oil companies are now disclosing the value of the production entitlements they pay in kind to governments, both in volume and in price terms. Assembling these we built a small table of oil prices.
Data source: BP, Shell, Statoil 2015 mandatory payment disclosures. Data from the disclosures is available on resourceprojects.org
The above graph displays the price of oil in 2015 across BP, Shell and Statoil projects. Prices spread across a wide range, with most observations between USD 20 to USD 55 per barrel. Reported oil price in Libya is surprisingly high. There are also wide variations in the price of oil for projects in the same country. The price reported by Shell from SPDC East is much lower than for other Nigerian projects, a finding that led to civil society raising questions. We also found significant differences between the prices reported by BP and Statoil for the same projects and period in Azerbaijan.
Data source: Statoil 2014 and 2015 mandatory payment disclosures
In the case of Statoil, we could calculate the change across two years of disclosures. We found that prices dropped by an average of 47 percent from 2014 to 2015—roughly equivalent to the drop in the Brent price, a popular benchmark. But again, there was a significant variation in the proportions of reported price drops.
New data is also beginning to reveal the prices governments sell their oil for. This information should be published more systematically by both governments and in-country operators. In Azerbaijan, for example, this information was disclosed in its 2014 EITI report.
Source: Azerbaijan EITI 2014 report, Statoil 2014 payment disclosure
The above graph shows the price Azerbaijan national oil company SOCAR sold its own share of crude for in 2014. The graph above shows that Azeri state oil was sold at prices between USD 69 and USD 113. The average price (weighted by quantity) was USD 99 per barrel.
These figures are then compared with the reported production entitlement values discussed above. For the same year, Statoil reported on the two producing projects in Azerbaijan. They reported a price of USD 103.4 per barrel for the Azeri, Chirag and Gunashli (ACG) complex, the country’s largest oil project, contributing three-fourths of national oil production. They also reported a much lower USD 52.9 price for the Shah Deniz gas and condensate field. Taking a weighted average of the two yields a price of USD 97.5 per barrel.
To summarize, we find that in 2014, the Azeri government sold its oil at an average price USD 1.5 per barrel higher (at 99 USD) than the market value as reported by Statoil (at 97.5 USD). Of course, we don’t know many further details to evaluate these transactions, for example the timing difference between production and sales, or the risks involved in the oil trade. Access to oil sales contracts could shed light on how much of the price risk is borne by the oil trader and how much is on SOCAR.
The price data we present remains very limited, both in company and country coverage. However, we can already explore the range in prices, looking for patterns and outliers in both reported market value and government oil sale prices. As reports on payments to governmentscontinue growing, we are gaining valuable data on oil prices for free. We can start better exploiting these data to monitor taxation and promote better policymaking and informed discussions on the sector and on the broaderdebate on trade misinvoicing.
This is why initiatives such as Publish What You Pay’s “Data Extractors” program, as part of which this methodology was initially piloted, are crucial to build up more open data capacity among citizens across the globe.
Anton Rühling is the program manager at OpenOil, overseeing the development of all open data applications. David Mihalyi is an economic analyst with NRGI.
Read the next article
Lebanon oil and gas political deal: LOGI demands clarifications and transparency